
Average Revenue Per Account (ARPA) is a key metric that businesses use to assess the financial performance and growth potential of their offerings.
By understanding ARPA, companies can gain valuable insights into their revenue streams, customer segments, and overall business strategy. This article aims to provide a thorough overview of ARPA, including its definition, calculation, benefits, limitations, and strategies for improvement.
|
Key Element |
Description |
|---|---|
|
ARPA as a Key Metric |
ARPA offers critical insights into financial performance and growth potential of businesses. |
|
Calculating ARPA |
It's determined by dividing total revenue by the number of accounts, aiding in pricing and strategic decisions. |
|
Strategic Benefits |
Understanding ARPA allows targeted marketing and resource allocation to high-value customer segments. |
|
Limitations to Consider |
ARPA's insights can be misleading without context and may not suit all business models. |
|
Improving ARPA |
Strategies like upselling and pricing adjustments can greatly enhance ARPA and overall financial health. |
TLDR:
- ARPA (Average Revenue Per Account) is calculated by dividing total revenue by the number of accounts in a given period.
- Tracking ARPA over time lets you forecast revenue, set sales targets and identify high-value customer segments.
- A high ARPA reading can mask a small customer base; always pair the metric with broader segmentation data.
- Upselling, cross-selling and tiered pricing are the primary levers for raising ARPA without adding new accounts.
- Cello's peer-to-peer referral program is built to increase ARPA by turning existing users into an acquisition channel.
Understanding the concept of ARPA
ARPA, which stands for Average Revenue Per Account, is a financial metric that measures the average revenue generated from each customer or account within a specific time period. It provides businesses with a valuable indication of how much revenue they can expect to generate from their customer base.
But let's look deeper into the definition and importance of ARPA. This metric is calculated by dividing the total revenue generated from all accounts by the number of accounts. By doing so, businesses can gain insights into each customer's average value, allowing them to make informed decisions regarding pricing, marketing strategies, and revenue forecasting.
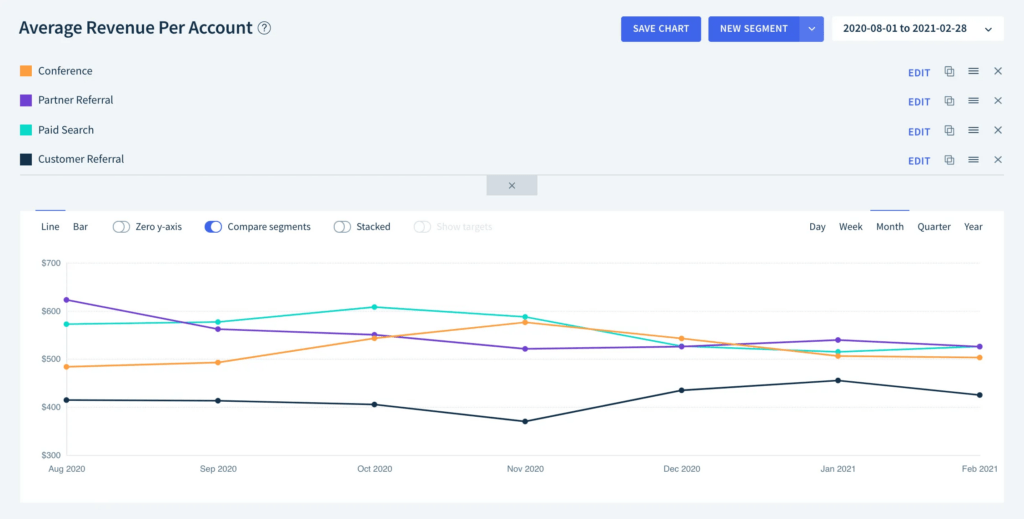
ARPA Overview of different marketing channels (Source: Medium)
By comparing the ARPA of different customer groups, organizations can identify high-value customers and tailor their marketing efforts accordingly. This targeted approach allows businesses to allocate their resources more effectively, focusing on customers who bring in higher revenue.
ARPA also provides valuable insights into customer behavior. By analyzing this metric over time, businesses can identify trends and patterns in customer spending habits. This information is key for adjusting product offerings and marketing strategies to better meet customer needs and preferences.
Calculating ARPA
Calculating ARPA (Average Revenue Per Account) is a key metric for businesses to understand their revenue generation and customer base.
By considering several key components and following a step-by-step process, organizations can gain valuable insights into their financial performance.
Key components in ARPA calculation
When calculating ARPA, there are two primary components that need to be considered: total revenue and the number of accounts.
Total revenue encompasses all the income generated from subscriptions, purchases, or any other sources over a specific time. This includes revenue from both new and existing customers, providing a thorough overview of the company's financial performance. Usually companies refer to Monthly-Recurring-Revenue (MRR).
The number of accounts refers to the total number of individual customers or accounts during the same period. This figure includes both active and inactive accounts, giving businesses an understanding of their customer base and potential market reach.
Step-by-step guide to calculate ARPA
To calculate ARPA accurately, follow these step-by-step instructions:
- Identify the time period: Determine the specific time period for which you want to calculate ARPA. This could be monthly, quarterly, or annually, depending on your business needs and reporting requirements.
- Sum up the total revenue (usually MRR): Add up all the revenue generated during the identified time period. This includes revenue from subscriptions, one-time purchases, upgrades, or any other sources. Be sure that you include all relevant income streams to get an accurate representation of your total revenue.
- Count the number of accounts: Determine the total number of accounts or customers during the same time period. This can be done by analyzing your customer database or CRM system. Include both active and inactive accounts to get a full view of your customer base.
- Divide the total revenue (MRR) by the number of accounts: Take the total revenue from step 2 and divide it by the number of accounts from step 3. This calculation will give you the Average Revenue Per Account (ARPA). ARPA is a key metric that helps businesses understand the average value generated by each customer or account.

The chart above shows the ARPA Formula (Source: Cello).
By following this step-by-step guide, businesses can calculate ARPA accurately and gain insights into their revenue generation and customer base.
This information can then be used to make informed decisions, optimize pricing strategies, and identify opportunities for growth and improvement.
Benefits of using ARPA
ARPA offers several benefits to businesses, allowing them to make data-driven decisions and improve their overall performance.
ARPA for revenue forecasting
By analyzing ARPA trends over time, businesses can forecast future revenue and plan accordingly. It helps in budgeting, setting sales targets, and identifying potential areas for growth.
For example, a subscription business tracking monthly ARPA alongside account count can project next quarter's revenue by multiplying expected account growth by the current ARPA figure, then adjusting for seasonal churn patterns observed in prior periods. A finance team might combine ARPA with a rolling 12-month average to smooth out one-off spikes from large enterprise deals, giving sales leadership a more reliable baseline for quota setting.
Segmenting ARPA by plan tier before forecasting also helps. If enterprise accounts show rising ARPA while self-serve accounts stay flat, that signals where to focus expansion efforts and where new acquisition volume matters more than per-account revenue gains.
ARPA for customer segmentation
ARPA allows businesses to segment their customer base, identifying high-value customers contributing greatly to revenue.
Businesses can further enhance customer satisfaction and retention by tailoring marketing efforts and providing personalized experiences.
Limitations of ARPA
While ARPA is a powerful metric, it also has its limitations. It is important to consider these limitations when interpreting the results.
Potential misinterpretations of ARPA
ARPA may not provide a complete picture of customer behavior and preferences. For instance, a high ARPA may indicate that a business has a small number of high-value customers, while a low ARPA could suggest a large customer base with lower-value accounts.
For that reason, additional analysis and consideration are required to understand the customer base in full.
When not to use ARPA
ARPA may not be suitable for all businesses or industries. Companies with a diverse range of products or services may find that individual ARPA calculations do not adequately represent the various revenue streams. In such cases, businesses should consider metrics such as ARPU per product line or blended customer lifetime value instead.
For example, a marketplace business connecting buyers and sellers may find ARPA unhelpful because revenue per account varies widely based on transaction volume rather than a subscription fee. Similarly, early-stage startups with a handful of large enterprise contracts alongside many free or trial accounts can see ARPA figures skewed by a few outliers, masking the real picture of customer value. Usage-based pricing models, where charges fluctuate month to month, also make ARPA less reliable as a planning input. In these situations, metrics such as customer lifetime value, revenue per cohort, or net revenue retention often give a clearer read on business health than a single blended average.
Improving ARPA
Businesses can implement strategies to increase ARPA, leading to higher revenue and improved financial performance.
Strategies for increasing ARPA
One approach to increasing ARPA is upselling and cross-selling. Businesses can increase their revenue per account by offering premium products or additional services to existing customers.
On top of that, implementing pricing strategies, such as tiered pricing models or introducing value-added features, can help drive higher ARPA.

Showcase favorite pricing tiers (Source: Intercom)
Monitoring and adjusting ARPA over time
Businesses should continuously monitor their ARPA and make adjustments based on market conditions, customer feedback, and industry trends. By analyzing changes in ARPA and taking proactive measures, companies can secure sustainable growth and maintain a competitive edge.
However, it is important to consider the limitations of ARPA and implement effective strategies to improve and monitor ARPA over time. By using this metric effectively, businesses can enhance their financial performance and maximize the value of their customer base.
Maximize your ARPA with Cello's referral program
Understanding your Average Revenue Per Account (ARPA) is just the beginning. Take your SaaS product to the next level by turning your users into a powerful growth channel with Cello. Our peer-to-peer referral program can be smoothly integrated into your product in hours, not days, empowering your users to share your product with ease. With Cello, you'll enjoy a suite of features designed to accelerate viral growth and boost your ARPA, including automated rewards, real-time performance tracking, and compliance with the highest security standards. Ready to see how Cello can turn your user referrals into a thriving growth engine? Book a demo today and start making the most of user-led growth.
How do you calculate ARPA for a SaaS business with both monthly and annual subscribers?
Use monthly recurring revenue (MRR) as your numerator and count only paying accounts from the same reporting period. Normalize annual subscriptions to their monthly value, exclude one-time setup fees and churned accounts, and count each account once even if it holds multiple subscriptions. Label any figure that mixes variable usage charges with subscription revenue separately so the two measures do not get conflated.
What is ARPA and why do SaaS companies track it?
Average Revenue Per Account (ARPA) is total monthly recurring revenue divided by the number of paying accounts in the same period. SaaS companies track it because it reveals the average revenue contribution per customer, which feeds revenue forecasting, pricing decisions and customer segmentation, letting growth teams identify which cohorts warrant higher acquisition spend.
Should I segment ARPA by customer type instead of reporting a single company-wide figure?
Yes, a single blended ARPA figure can hide meaningful differences between cohorts. A small group of high-value enterprise accounts will inflate the average and make a large base of lower-value accounts look more profitable than they are. Segment by subscription tier, acquisition channel or account size to get figures that actually inform pricing and resource allocation decisions.
How does tracking referred versus non-referred accounts improve ARPA analysis?
Comparing ARPA across referred and non-referred cohorts shows whether peer-acquired customers generate more recurring revenue per account than those from paid or organic channels. Run the standard MRR-divided-by-paying-accounts formula separately for each cohort over the same period, using your billing analytics instead of aggregate totals, so any ARPA difference reflects genuine revenue quality instead of account-count distortion.
Can Cello use HubSpot lifetime revenue totals or a backend-sent amount without Stripe?
Cello accepts backend-sent purchase events without Stripe, but its documented purchase flow expects an invoice amount, not a running lifetime revenue total. The Cello purchase-tracking guide requires a referral code, customer identity, amount, currency, invoice ID, payment interval and product or plan key through its application programming interface (API). That guide does not confirm direct ingestion of HubSpot cumulative revenue properties or arbitrary aggregate totals. Confirm any HubSpot mapping or aggregation design with Cello before using it to trigger rewards. For monthly ARPA reporting, use revenue from the reporting month; a lifetime total is a different measure.
Can Cello track transactional revenue without Stripe, and should I use GMV for ARPA?
Cello documents purchase tracking without Stripe for recurring transactions and one-time purchases through its application programming interface (API). Capture the referral code, track signup and send an invoice-paid event for each successful purchase with the matching user or organization identity. Send a charge-refunded event when a payment is refunded; Cello's purchase-event documentation states that this cancels pending rewards for that transaction. For a gross merchandise value (GMV) business, agree with Cello whether the reward basis should be gross transaction value or retained fees before mapping the amount. For ARPA, use the revenue your business recognizes per account over the reporting period; do not treat money passed through to sellers as your own revenue. Keep transactional ARPA separate from subscription recurring-revenue ARPA.