
The Software-as-a-Service (SaaS) business model has become increasingly popular. However, succeeding in this competitive industry requires more than just a great product or service. It requires diligent monitoring and analysis of key SaaS metrics that truly matter.
By understanding these metrics and their impact on business growth, decision-making, and overall performance, SaaS companies can make informed strategic decisions to drive success.
TLDR:
- MRR is the primary health signal for SaaS businesses; consistent growth confirms a scalable model, decline signals churn or pricing failure.
- A CLV:CAC ratio below 3:1 signals unsustainable unit economics; the B2B SaaS median sits at 3.6:1 (Benchmarkit 2025).
- High churn undermines every acquisition effort; reducing it requires better onboarding, proactive at-risk tracking and retention incentives.
- An NPS below 51 (the software sector average per CustomerGauge) signals satisfaction gaps that compound into churn before they show in revenue metrics.
- Cello’s data shows referred customers have higher LTV, making peer-to-peer referral programs a direct lever on both CAC and retention metrics.
|
Key Element |
Description |
Tips for Optimization |
|---|---|---|
|
Definition of SaaS Metrics |
SaaS metrics are key performance indicators that provide insights into a company’s performance. |
Regularly track and analyze to identify trends and make data-driven decisions. |
|
Role in Business Growth |
SaaS metrics help gauge overall growth, revenue generation, customer acquisition, and retention. |
Focus on metrics that point to areas for improvement and opportunities. |
|
Influence on Decision Making |
Accurate metrics guide pricing strategies, resource allocation, and overall decision-making. |
Use metrics to align cross-functional teams and drive cohesive decision-making. |
|
Key SaaS Metrics |
Includes MRR, CAC, CLV, churn rate, and NPS. |
Monitor these metrics to improve customer acquisition, retention, and overall growth. |
Understanding the importance of SaaS metrics
Before getting into the specific metrics, it’s important to comprehend the significance of SaaS metrics in driving business growth.
📊 SaaS metrics act as a compass, providing valuable insights into various aspects of a company’s performance. By measuring and tracking these metrics, businesses can identify trends, measure the effectiveness of strategies, and make data-driven decisions to optimize performance.
SaaS metrics give you both a snapshot of a company’s current standing and a roadmap for future success.
By analyzing these metrics over time, businesses can forecast growth, anticipate challenges, and proactively adjust their strategies to stay ahead in a competitive market.
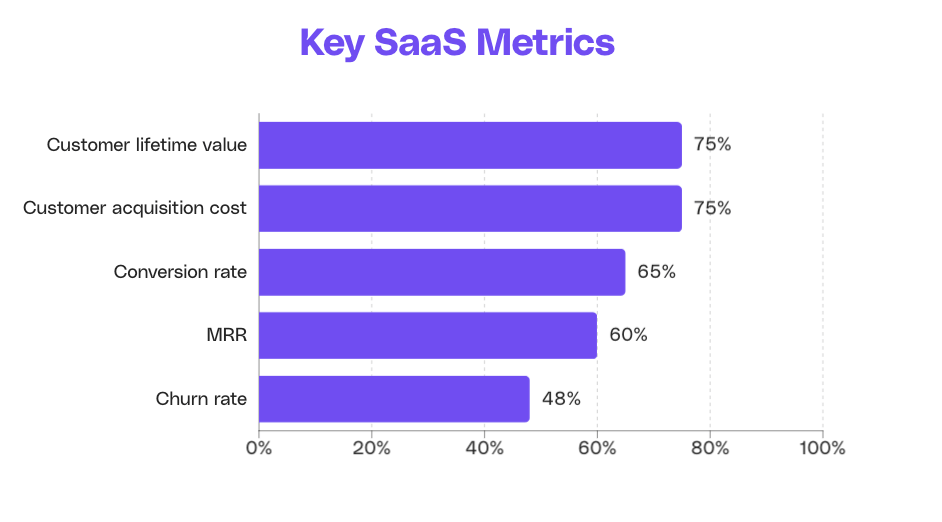
Which SaaS metrics do companies track on a monthly basis? (Source: Databox)
The role of SaaS metrics in business growth
Effective business growth requires a deep understanding of the metrics that contribute to success. SaaS metrics serve as key performance indicators (KPIs) that help companies gauge their overall growth path.
These metrics provide insights into revenue generation, customer acquisition and retention, profitability, and more, helping businesses identify areas of improvement and act on opportunities.
SaaS metrics also offer a full view of the customer journey, allowing businesses to tailor their products and services to meet evolving needs.
By analyzing metrics such as customer lifetime value, churn rate, and customer acquisition cost, companies can fine-tune their offerings, enhance customer satisfaction, and build long-term relationships with their client base.
How SaaS metrics influence decision making
For decision-making, having accurate and up-to-date information matters a great deal. SaaS metrics play a key role in influencing decisions at various levels within a company.
From setting pricing strategies to allocating resources, understanding these metrics allows businesses to make informed decisions that align with their growth objectives.
What’s more, SaaS metrics empower cross-functional teams within an organization to collaborate effectively towards common goals.
By providing a shared set of performance indicators, these metrics aid communication, build transparency, and drive alignment across departments, in the end leading to cohesive decision-making processes and smoother operations.
Key SaaS metrics to monitor
Now that we understand the importance of SaaS metrics, let’s look at some key metrics that every SaaS company should monitor.
Monthly recurring revenue (MRR) and annual recurring revenue (ARR)
MRR is one of the most important metrics for SaaS companies as it represents the predictable revenue stream from subscriptions. Monitoring MRR allows businesses to assess their revenue stability, identify growth trends, and gauge the effectiveness of pricing strategies.
Tracking MRR over time reveals the health of a SaaS business. Consistent month-over-month growth signals a scalable model, while a prolonged decline points to churn or pricing issues that need attention before they compound.
On the other hand, a decline in MRR may signal issues such as customer churn or pricing problems that need to be resolved promptly.

Source: Cello
By multiplying MRR by 12, it is possible to obtain ARR.

Source: Cello
Customer acquisition cost (CAC)
CAC represents the cost incurred to acquire a new customer. By measuring CAC, SaaS companies can gauge the effectiveness of their sales and marketing efforts.
A lower CAC indicates effective customer acquisition strategies, while a higher CAC may require adjustments to improve customer acquisition performance.
Calculating CAC involves factoring in expenses related to sales and marketing activities, such as advertising costs, salaries of sales teams, and overhead costs.
By optimizing CAC, SaaS companies can maximize their return on investment and drive sustainable growth in customer acquisition. There are several ways to minimize CACs:
- Choose the best acquisition channels, e.g. carefully deciding when to use paid and organic acquisition channels.
- Use the right number of acquisition channels: more channels might allow you to reach a wider network, but this should be financially sustainable. Optimize your funnel to improve this.
- Identify your best customers: is one of your acquisition channel producing higher-value customers? If so, redirecting resources towards this channel may be a good investment.
- Start user and affiliate referral programs: these tend to be lower cost than paid ads. Referral programs can lower blended CAC when paid acquisition gets expensive, and they allow you to improve customer retention.
- Use marketing automation tools to improve performance.

Source: Cello
Customer lifetime value (CLV)
CLV refers to the total revenue a business can expect from a customer over their lifetime. Understanding CLV helps SaaS companies determine the value of acquiring and retaining customers. By increasing CLV, businesses can improve profitability and focus on customer retention strategies.
Enhancing CLV can involve several aspects:
- Deliver exceptional customer experiences, as these will satisfy your customers and keep them hooked to your product.
- Ask customers for feedback: if customers feel heard and valued, they are more likely to feel as if they are impacting the company’s future.
- Offer referral and loyalty programs: these are cost-effective ways to keep your customers happy and incentivize them to advocate for your brand.
- Provide targeted and personalised campaigns: this will further increase customers’ feeling of being valued, while increasing the likelihood of new purchases.
- Offer additional value through upselling or cross-selling, as well as content production.
By putting CLV first, SaaS companies can build a loyal customer base, increase profitability, and drive sustainable revenue growth over time. Cello’s data shows that referred customers have higher LTV, making referral programs a direct lever on this metric.

Source: Cello
CLV:CAC ratio
The CLV:CAC ratio is key for assessing the effectiveness of customer acquisition efforts relative to the revenue generated from those customers over their lifetime. A higher ratio indicates that the revenue from customers far exceeds the cost of acquiring them, signaling a healthy business. According to Benchmarkit’s 2025 SaaS Performance Metrics report, the median CLV:CAC ratio for private B2B SaaS companies is 3.6:1, meaning 3:1 is the floor, not the target. A ratio below 3:1 signals unsustainable unit economics; a ratio above 5:1 may indicate underinvestment in growth.
It is simply measured by dividing CLV by CAC. To improve it, companies should either increase CLV and/or decrease CACs, using the strategies mentioned above.
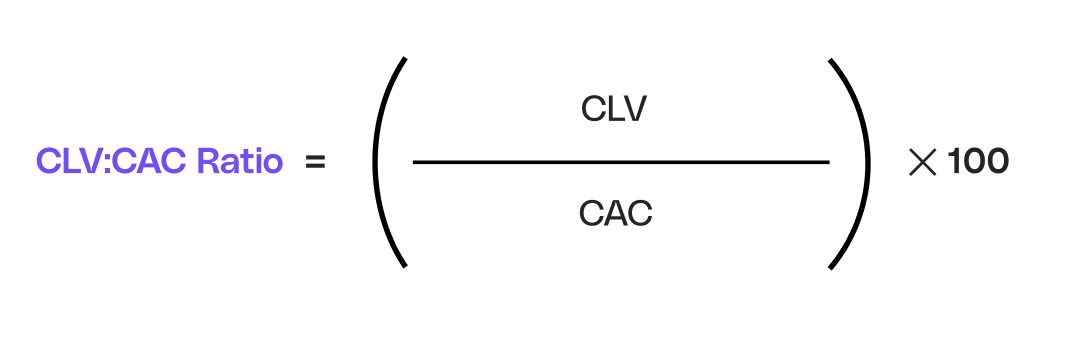
Source: Cello
Churn rate
Churn rateindicates the percentage of customers who cancel their subscriptions within a specific timeframe. A high churn rate often points to issues like customer dissatisfaction, unmet needs, or a weak value proposition.
Analyzing churn rate helps companies identify root causes and areas for improvement. By understanding these factors, businesses can create targeted strategies to boost customer satisfaction and retention.
To reduce churn, companies should focus on several aspects, including:
- Regular new features and improved customer support.
- Easy onboarding.
- Personalised communication and frequent customer engagement.
- Tailored recommendations and training sessions to educate customers on how to extract the most value from your product.
- Track profiles at risk (particularly in B2B), as this will make you more proactive.
- Offer incentives, such as discounts and referral programs.
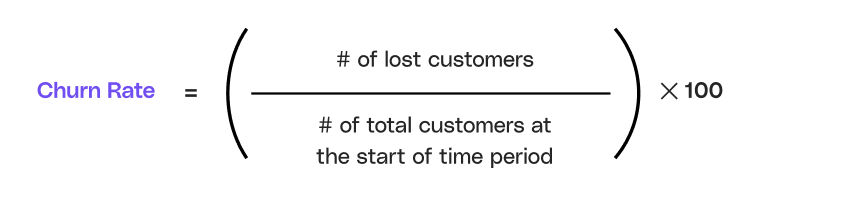
Source: Cello
Conversion rate
The conversion rate is a key metric for measuring the effectiveness of a SaaS company’s marketing and sales strategies. It indicates the percentage of prospects who take a desired action, such as making a purchase or signing up for a service.
The lead conversion rate measures the percentage of leads that become paying customers. By improving this rate, companies can maximize the return on their lead generation efforts, so that more potential customers are effectively nurtured through the sales funnel.

Source: Cello
The signup rate focuses

Source: Cello
Overall, the general conversion rate reflects the
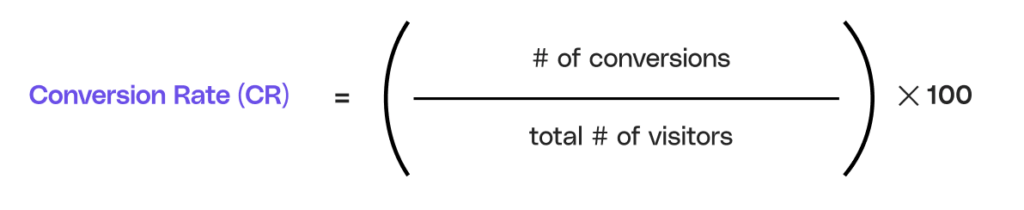
Source: Cello
Customer retention rate
The customer retention rate reflects the percentage of customers who continue to use a product or service during a specific period, indicating the effectiveness of retention strategies.
High customer retention rates are key for long-term profitability and growth. They reflect customer satisfaction, loyalty, and the company’s ability to deliver ongoing value.
Some common strategies to improve the customer retention rate include:
- Making the customer experience smooth at all steps, providing excellent support and asking for feedback.
- Implementing loyalty and referral programs.
- Expand your value proposition, to target and retain a wider range of clients.
- Contact your clients regularly, building a relationship with them and understanding their perspective.
- Personalise as much as you can, as it will make clients feel valued.
- Host events, webinars and similar activities to engage with your clients. For example, Intercom runs product webinars tied to new feature releases, using the session as both an education touchpoint and a retention signal for at-risk accounts.
- Thank your clients, whether through simple messages or personalised physical gifts, acts of gratitude will help build a deeper relationship with your clients.
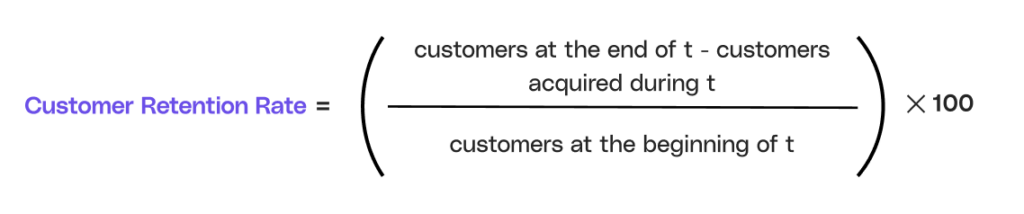
Source: Cello
Revenue retention rate
The revenue retention rate measures the percentage of recurring revenue retained from existing customers over a specific period. High revenue retention indicates that customers continue to find value in the product, leading to steady revenue.
Improving revenue retention involves enhancing customer satisfaction, providing exceptional support, offering flexible pricing tiers, and analysing data on customer behaviour.

Source: Cello
Revenue growth rate
The revenue growth rate measures how quickly a company’s revenue is increasing over a specific period. This metric is key for assessing a company’s performance and future prospects.
A healthy revenue growth rate indicates successful customer acquisition and retention efforts, and reflects strong market demand.
To maintain a healthy revenue growth rate, companies should focus on effective marketing and sales strategies to attract new customers, deliver exceptional service to retain existing ones, and continuously innovate their product offerings. By putting these areas first, companies can achieve steady revenue growth and long-term success.
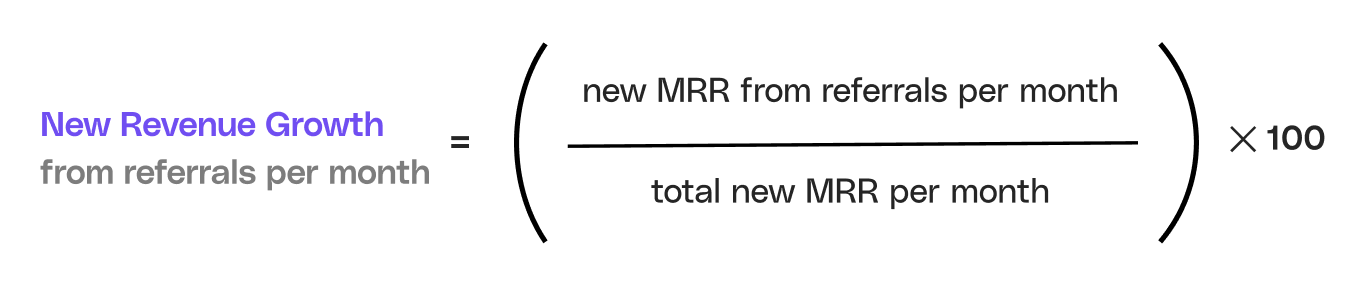
Source: Cello
Customer retention cost
Customer retention cost refers to the expenses incurred to retain existing customers, including costs related to customer support, loyalty programs, and personalized marketing efforts. In practice, this spans salaries for customer success and support staff, tooling costs for CRM and engagement platforms, spend on loyalty and referral incentives, and the overhead of producing retention-focused content or training materials.
The formula is simple: Customer Retention Cost = Total retention spend / Number of retained customers. Tracking this as a distinct line item, instead of leaving it buried in general overhead, lets you compare the cost of keeping a customer against the cost of acquiring a new one, and identify which retention activities deliver the most value relative to their spend.
Assessing this metric allows SaaS companies to identify opportunities for optimizing resources to increase customer satisfaction and reduce churn.
By closely monitoring and managing customer retention costs, companies can develop more cost-effective strategies that enhance the customer experience without overspending. Lowering these costs can greatly impact overall profitability, as retaining existing customers is often more cost-effective than acquiring new ones.
Effective management of customer retention costs involves simplifying support processes, using automation for personalized communication, and continually assessing the value of retention initiatives.

Source: Cello
Net promoter score (NPS)
Net Promoter Score (NPS) is a key metric that measures customer loyalty and satisfaction by asking customers how likely they are to recommend a company’s product or service to others. Assessing NPS helps companies gauge customer sentiment and identify areas for improvement.
A high NPS indicates strong customer loyalty and satisfaction, while a low NPS surfaces potential issues that need to be resolved. According to CustomerGauge’s SaaS NPS Benchmarks, the software and technology sector averages an NPS of 51, making it a useful industry reference point for gauging where your score stands.
Improving NPS involves focusing on delivering exceptional customer experiences, resolving pain points, and building positive relationships. Regularly collecting and acting on customer feedback is key to making meaningful improvements.
By putting NPS first, SaaS companies can build stronger customer relationships, reduce churn, and drive long-term growth.

Source: Cello
Grow with Cello’s peer-to-peer referral program
As you focus on the SaaS metrics that matter, consider the untapped potential of peer-to-peer referrals to lower your Customer Acquisition Cost and boost your Monthly Recurring Revenue. Cello turns your users into powerful growth engines, smoothly integrating a referral program into your SaaS product. With minimal development time and a success-based pricing model, Cello empowers you to tap into user-led growth, automate rewards, and easily manage your program’s performance. Ready to see how Cello can reshape your growth strategy with peer-driven referrals? Book a demo and start turning your users into your most valuable growth channel today.
What is a good CLV:CAC ratio for a B2B SaaS company in 2026?
A CLV:CAC ratio of 3:1 is the floor, not the target. According to Benchmarkit’s 2025 SaaS Performance Metrics report, the median for private B2B SaaS companies sits at 3.6:1. A ratio below 3:1 signals unsustainable unit economics, while a ratio above 5:1 may indicate underinvestment in growth.
What’s the fastest way to improve both CAC and customer LTV at the same time for a B2B SaaS product?
Referral programs reduce blended CAC by replacing a portion of paid acquisition spend with peer-driven referrals at lower cost. Pair them with the retention tactics covered above, such as easier onboarding and at-risk account tracking, to raise CLV at the same time.
How do I know if my SaaS churn rate is a product problem or an onboarding problem?
Track when churn occurs relative to the customer lifecycle: churn concentrated in the first 60-90 days typically points to onboarding gaps or unmet expectations set during sales, while churn at renewal is more likely a value-realization or competitive displacement problem. Segmenting churn timing against onboarding completion milestones and feature adoption data gives you the clearest signal on root cause before investing in a fix.
What NPS score should a SaaS company be aiming for, and when does a low score predict churn?
A score below the sector average is worth treating as a leading churn indicator. Satisfaction gaps tend to compound into cancellations before they show up in revenue metrics, so acting on NPS data before the renewal window is more effective than responding after the fact.
Should I use MRR or ARR to report SaaS business health to investors and internal stakeholders?
Use both, for different purposes. MRR is the primary health signal for day-to-day monitoring. Consistent month-over-month growth confirms a scalable model, while a decline surfaces churn or pricing issues early enough to act on. ARR, calculated by multiplying MRR by 12, gives the bigger picture needed for annual comparisons, investor reporting and strategic planning where monthly fluctuations would obscure the trend.
What is a good CLV:CAC ratio for a B2B SaaS company in 2026?
A CLV:CAC ratio of 3:1 is the floor, not the target. According to Benchmarkit's 2025 SaaS Performance Metrics report, the median for private B2B SaaS companies sits at 3.6:1 — a ratio below 3:1 signals unsustainable unit economics, while a ratio above 5:1 may indicate underinvestment in growth.
What's the fastest way to improve both CAC and customer LTV at the same time for a B2B SaaS product?
Referral programs are one of the few levers that move both metrics simultaneously. They reduce blended CAC by replacing a portion of paid acquisition spend with peer-driven referrals at lower cost, and Cello's data shows that referred customers have higher LTV than those acquired through other channels, meaning the same program that lowers acquisition cost also improves the quality of customers retained.
How do I know if my SaaS churn rate is a product problem or an onboarding problem?
Track when churn occurs relative to the customer lifecycle: churn concentrated in the first 60-90 days typically points to onboarding gaps or unmet expectations set during sales, while churn at renewal is more likely a value-realization or competitive displacement problem. Segmenting churn timing against onboarding completion milestones and feature adoption data gives you the clearest signal on root cause before investing in a fix.
What NPS score should a SaaS company be aiming for, and when does a low score predict churn?
The software and technology sector averages an NPS of 51 according to CustomerGauge's SaaS NPS Benchmarks, making that a practical reference point for gauging where your score stands. A score below that average is worth treating as a leading churn indicator. Satisfaction gaps tend to compound into cancellations before they show up in revenue metrics, so acting on NPS data before the renewal window is more effective than responding after the fact.
Should I use MRR or ARR to report SaaS business health to investors and internal stakeholders?
Use both, for different purposes. MRR is the primary health signal for day-to-day monitoring. Consistent month-over-month growth confirms a scalable model, while a decline surfaces churn or pricing issues early enough to act on. ARR, calculated by multiplying MRR by 12, gives the bigger picture needed for annual comparisons, investor reporting and strategic planning where monthly fluctuations would obscure the trend.