
A marketer pulls up a campaign report, sees a big number at the top and cannot tell whether it counts people or views. In the next meeting, reach, impressions and engagement get used as if they mean the same thing, so budget decisions follow whichever figure looks best instead of the one that actually reflects how the audience responded.
TLDR:
- Reach counts unique users once; impressions count every display, so impressions always equal or exceed reach.
- Engagement rate = engagements divided by impressions or reach, multiplied by 100, expressed as a percentage.
- A low rate paired with low reach signals an audience size problem; high impressions with low engagement signals frequency fatigue.
- Match the metric to your goal, with reach for awareness, impressions for visibility and frequency and engagement for content quality.
- A healthy engagement rate runs between 1 and 5% on most social platforms; above 3% is a common target for influencer content.
Reach is the number of unique people who saw the content. Impressions count the total times the content appeared on a screen, so repeat views by the same person count more than once. Engagement covers the actions people take, such as likes, shares, comments and clicks. The Engagement Rate turns these actions into a percentage of impressions or reach, showing how much of that audience actually responded. Telling the three apart matters because a low rate paired with low reach points to an audience size problem, a low rate with high impressions points to frequency fatigue and a low rate with strong reach points to weak content, so budget decisions follow the right signal instead of a guess.
Understanding and optimizing the Engagement Rate is a core aspect of Growth Marketing. A high value indicates that the content or product connects with the audience, which can lead to increased brand awareness, customer loyalty and business growth. Conversely, a low value may signal that the content or product is not meeting the audience’s needs or expectations, indicating a need for improvement or change.
Updated October 12, 2026.
|
Key Element |
Description |
|---|---|
|
Understanding Engagement Rate |
Measure of interaction with content, products, or services, often expressed as a percentage. |
|
Components |
Engagements, Impressions, Reach. |
|
Importance in Growth Marketing |
Core metric of audience response; high rate leads to increased brand awareness and loyalty. |
|
Improvement Strategies |
Creating high-quality content, optimizing for platforms, using calls to action. |
|
Measurement and Analysis |
Using analytics tools and data analysis techniques to track performance and make data-driven decisions. |
Key components
The Engagement Rate is calculated by dividing the number of engagements by the total number of impressions or reach, and then multiplying by 100 to get a percentage.
Components vary by platform or medium, but most include engagements, impressions and reach.
Here is how the three metrics compare at a glance:
|
Metric |
What it measures |
Counts the same user multiple times? |
Primary use case |
|---|---|---|---|
|
Reach |
Unique users who saw your content |
No, each user is counted once |
Measuring audience size and brand awareness |
|
Impressions |
Total number of times your content was displayed |
Yes, every view counts |
Gauging content visibility and frequency |
|
Engagement |
Actions users took, such as likes, shares, comments and clicks |
Yes, each action counts, so one user can add several |
Measuring how well content prompts action |
Engagements
Users take these actions in response to a piece of content or a product. They can include likes, shares, comments, clicks, views and more. The specific types of engagements that are counted can vary depending on the platform or medium.
Impressions
Impressions refer to the number of times a piece of content or a product is displayed, regardless of whether it was clicked or not. This can include views of a webpage, displays of an advertisement or appearances in a social media feed. Impressions will always be equal to or greater than reach, never less. A single user can generate multiple impressions by viewing the same content more than once, but that user counts only once toward reach.
However, impressions alone do not provide a complete picture of engagement. A piece of content or product could have many impressions but a low Engagement Rate if few people are interacting with it. This is why it’s important to consider both impressions and engagements when calculating this metric.
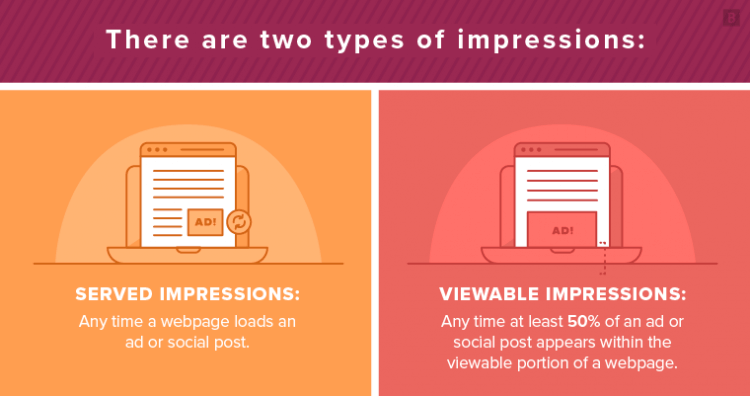
There are different ways of calculating impressions (Source: Brafton)
Reach
Reach refers to the number of unique individuals who have seen a piece of content or a product. Unlike impressions, which count every display of the content or product, reach only counts each individual once, regardless of how many times they have seen the content or product.
Reach provides a measure of the size of the audience that a piece of content or product has reached. However, like impressions, reach alone does not provide a complete picture of engagement. A piece of content or product could have a high reach but a low Engagement Rate if few people are interacting with it. This is why it’s important to consider both reach and engagements when calculating this value.
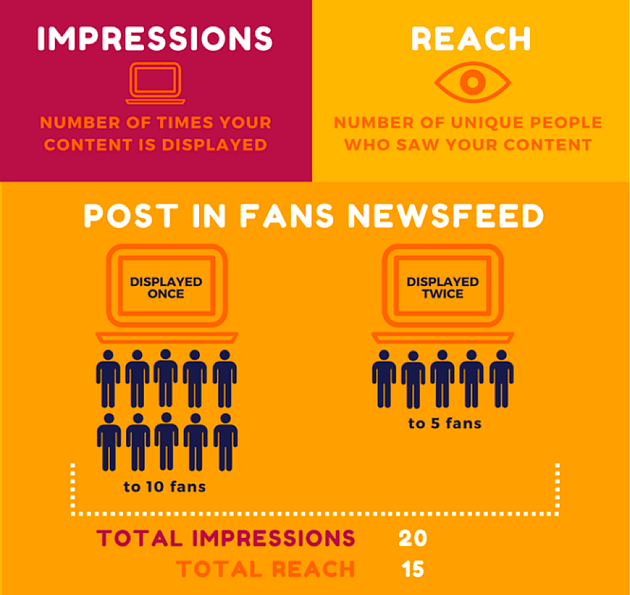
Reach and impressions involve different calculations (Source: Lyfe Marketing)
Here is how all three metrics play out in a single scenario. You publish one post and 90 unique users see it (Reach = 90). Each of them scrolls past it twice, so it appears 180 times in total (Impressions = 180). Of those users, 30 like it, 5 comment and 2 share it (Engagement = 37). Impressions always equal or exceed reach, and engagement measures the subset of viewers who took action.
Importance in growth marketing
The Engagement Rate is a critical metric in Growth Marketing because it measures how effectively a piece of content or a product is landing with its intended audience. A high Engagement Rate indicates that the content or product is meeting the audience’s needs and expectations, which can lead to increased brand awareness, customer loyalty and business growth.
Choosing the right metric for your goal
- Reach is the primary metric when your goal is brand awareness or launching to a new audience.
- Impressions are the primary metric when you want to evaluate content visibility and frequency, such as retargeting or top-of-funnel ads.
- Engagement is the primary metric when your goal is community building, lead nurturing or measuring content quality.
Brand awareness
A high Engagement Rate can increase brand awareness by exposing the brand to a larger audience. When users engage with a piece of content or a product, they are more likely to share it with others, increasing its reach and visibility. This can lead to increased recognition and awareness of the brand, which can in turn drive growth.
Engagement also increases brand recall, which is the ability of consumers to recognize and remember a brand. When users engage with a piece of content or a product, they are more likely to remember the associated brand. This can increase the likelihood that they will think of the brand when making a purchase decision, increasing its market share and driving growth.
Customer loyalty
A high rate can also increase customer loyalty by creating a positive user experience. When users engage with a piece of content or a product, they interact with the brand meaningfully. This can create a sense of connection and loyalty to the brand, increasing the likelihood that they will continue to engage with it.
Engagement also increases customer satisfaction, which is the degree to which a product or service meets the customer’s expectations.
When users engage with a piece of content or a product, they indicate that it meets their needs and expectations. This can increase their satisfaction with the brand, increasing the likelihood that they will continue to engage with the brand in the future, driving growth.
Improvement strategies
There are several strategies that marketers can use to improve the Engagement Rate. These strategies focus on creating content and products that match what the audience wants, encouraging them to engage. By implementing these strategies, marketers can increase the Engagement Rate, driving growth.
Effectiveness varies by audience and channel, so test each strategy and keep the ones that raise the Engagement Rate. Test and optimize each strategy so it measurably raises the Engagement Rate.
Creating high-quality content
Start by pulling the last 10 to 20 posts you published and ranking them by Engagement Rate. Look at what the top performers share in topic, format and opening line, then repeat those patterns in the next batch of content. A pattern that shows up only once could be chance, but a pattern that shows up across several top posts is worth testing again.
Pull topics from customer feedback and from the questions that sales and support teams hear on repeat, since those are the subjects the audience already cares about. When you use A/B testing on a change, such as a new format or a different opening line, change one variable at a time so you know which change moved the Engagement Rate.
Optimizing content for the platform
Another effective strategy for improving the Engagement Rate is optimizing the content for the platform or medium used. This means creating content that is designed to perform well on a specific platform or medium. For example, video content may perform well on social media, while long-form content may perform well on blogs or websites.
It’s important to understand the platform’s algorithms and user behavior to optimize content for the platform. This can be done through platform-specific research and testing. By understanding the platform, marketers can create optimized content, increasing the Engagement Rate.
Using calls to action
Using calls to action is another effective strategy for improving the Engagement Rate. Calls to action are prompts that encourage users to take a specific action, such as liking, sharing, commenting or clicking. Marketers can encourage users to engage with the content or product by using calls to action, increasing the Engagement Rate.
Use calls to action strategically, because overuse can lead to user fatigue and lower engagement. Test the wording and placement of each prompt and keep the versions that raise the Engagement Rate.
Measurement and analysis
Measuring and analyzing the Engagement Rate is a critical part of Growth Marketing. By measuring this metric, marketers can track the performance of their content and products against their key performance indicators, identify areas for improvement and make data-driven decisions to drive growth.
There are several tools and techniques that marketers can use to measure and analyze the Engagement Rate. These tools and techniques can provide valuable insights into the audience’s behavior, the performance of the content or product, and the effectiveness of the marketing strategies.
Calculation
Applying the earlier scenario shows how the choice of denominator changes the result: 37 engagements divided by 180 impressions, multiplied by 100, gives 20.6% by impressions, while 37 engagements divided by 90 reach, multiplied by 100, gives 41.1% by reach. Pick one denominator and use it consistently across reports so numbers stay comparable over time.
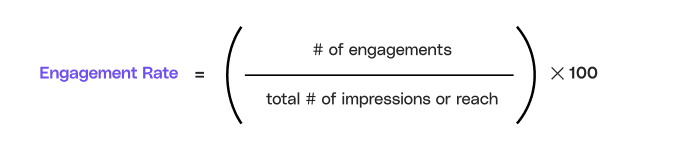
Engagement rate formula
Analytics tools
Analytics tools are software applications that collect, analyze and report data. They can be used to measure the Engagement Rate, track the performance of the content or product and provide insights into the audience's behavior. Google Analytics 4 reports an engagement rate for site sessions, calculated as the share of engaged sessions out of total sessions. Native social tools such as Meta Business Suite, LinkedIn page analytics and X analytics report reach, impressions and interactions for each post.
These tools do not all define the Engagement Rate the same way. Some divide actions by reach and others divide by impressions, so confirm each tool's definition before comparing numbers across channels. A safer approach is to export the raw engagements, reach and impressions and apply one formula yourself.
Data analysis techniques
Data analysis techniques are methods used to process and interpret data. They can be used to analyze the data collected by the analytics tools, identify patterns and trends, and make data-driven decisions. Some popular data analysis techniques include descriptive, trend and predictive analyses.
These techniques can provide valuable insights into the Engagement Rate and its impact on growth. For example, trend analysis can reveal changes in the Engagement Rate over time, indicating the effectiveness of the marketing strategies. Predictive analysis can forecast future changes in the Engagement Rate, providing valuable information for planning and decision-making.
What is the difference between reach and impressions?
Reach counts each unique user once, while impressions count every time the content appears on a screen, including repeat views by the same person. That makes impressions always equal to or greater than reach.
Is reach or engagement more important?
It depends on your goal. Reach matters most for awareness campaigns, while engagement matters most when you measure content quality or intent to convert. Reading the two together shows whether a large audience is actually responding.
What is a good engagement rate?
Benchmarks vary by platform and industry, and 1 to 5% is generally a healthy range on most social platforms according to MOGL's influencer benchmark guide. For influencer content, above 3% is a common target, and Pallyy's Instagram engagement guide treats that level as good.
Can you have high impressions but low engagement?
Yes, and it is common. It usually means the content is shown often but gives people no reason to act, so the messaging or creative needs refining.